
8 Business Process Mapping Methods and When to Use Each
Compare eight business process mapping methods, from flowcharts to process mining, and learn when each one helps teams see how work really runs.
A process diagram can look precise while telling the wrong story. Teams often map how a workflow is supposed to run, not how it actually operates. The result hides queues, duplicate approvals, unclear ownership and workarounds that add three weeks to a customer journey.
This guide compares eight common Business Process Mapping Methods, from basic flowcharts to process mining. You will learn:
- What each method reveals, and what it leaves hidden.
- Which situations justify the extra effort.
- How to choose a method for a stalled release, inherited codebase or operational bottleneck.
- Where to start when departments describe the same workflow differently.
The best map is not the most detailed one. It is the one that supports the decision you need to make.
Accurate mapping also matters beyond internal delivery. It is the diagnostic foundation of process improvement services from Wisely, and a weak map can send teams in the wrong direction before they begin rebuilding a platform or automating a service.
1. Basic Process Flowchart
A basic process flowchart is the quickest way to make an operational workflow visible. It represents each step as a shape, connects steps with arrows, and uses diamonds for decisions with labelled yes and no branches. Standard ISO 5807 symbols help teams read the same diagram consistently, whether the process involves invoice approvals, customer onboarding or software releases.
This method belongs near the start of any guide to business process mapping methods because it balances speed with clarity. It works best for a single, linear process that has a defined start and end. It is particularly useful when a team needs to agree on what happens before changing a system, automating work or handing the process to a managed-service businesses (MSPs).
When to use it
Choose a basic flowchart when:
- The process has roughly 12 to 20 steps and can fit on one page.
- Most work follows a predictable sequence.
- The team needs to identify delays, rework or missing approvals.
- Non-technical stakeholders must understand the workflow quickly.
It becomes less effective when several teams and systems share responsibility. A flowchart shows sequence, but not clear ownership, service-level commitments or dependencies between platforms.
Practical implementation
Start with one real case, not the idealised process. For example, an operations team might map a twelve-step invoice approval using one submitted invoice that took an unusual route. The team can then mark where the invoice waited for approval, entered rework or moved between departments.
Keep the diagram to one page. If the process grows beyond that, create linked sub-flowcharts rather than shrinking the text until it becomes unreadable. Before treating the map as accurate, walk through it with the person who performs the work. Their corrections often expose informal shortcuts that standard procedures do not capture.
A basic flowchart is strongest as a shared diagnostic tool, not as a complete operating model.
The following infographic compares the practical strengths of basic process flowcharts with their main limitations.
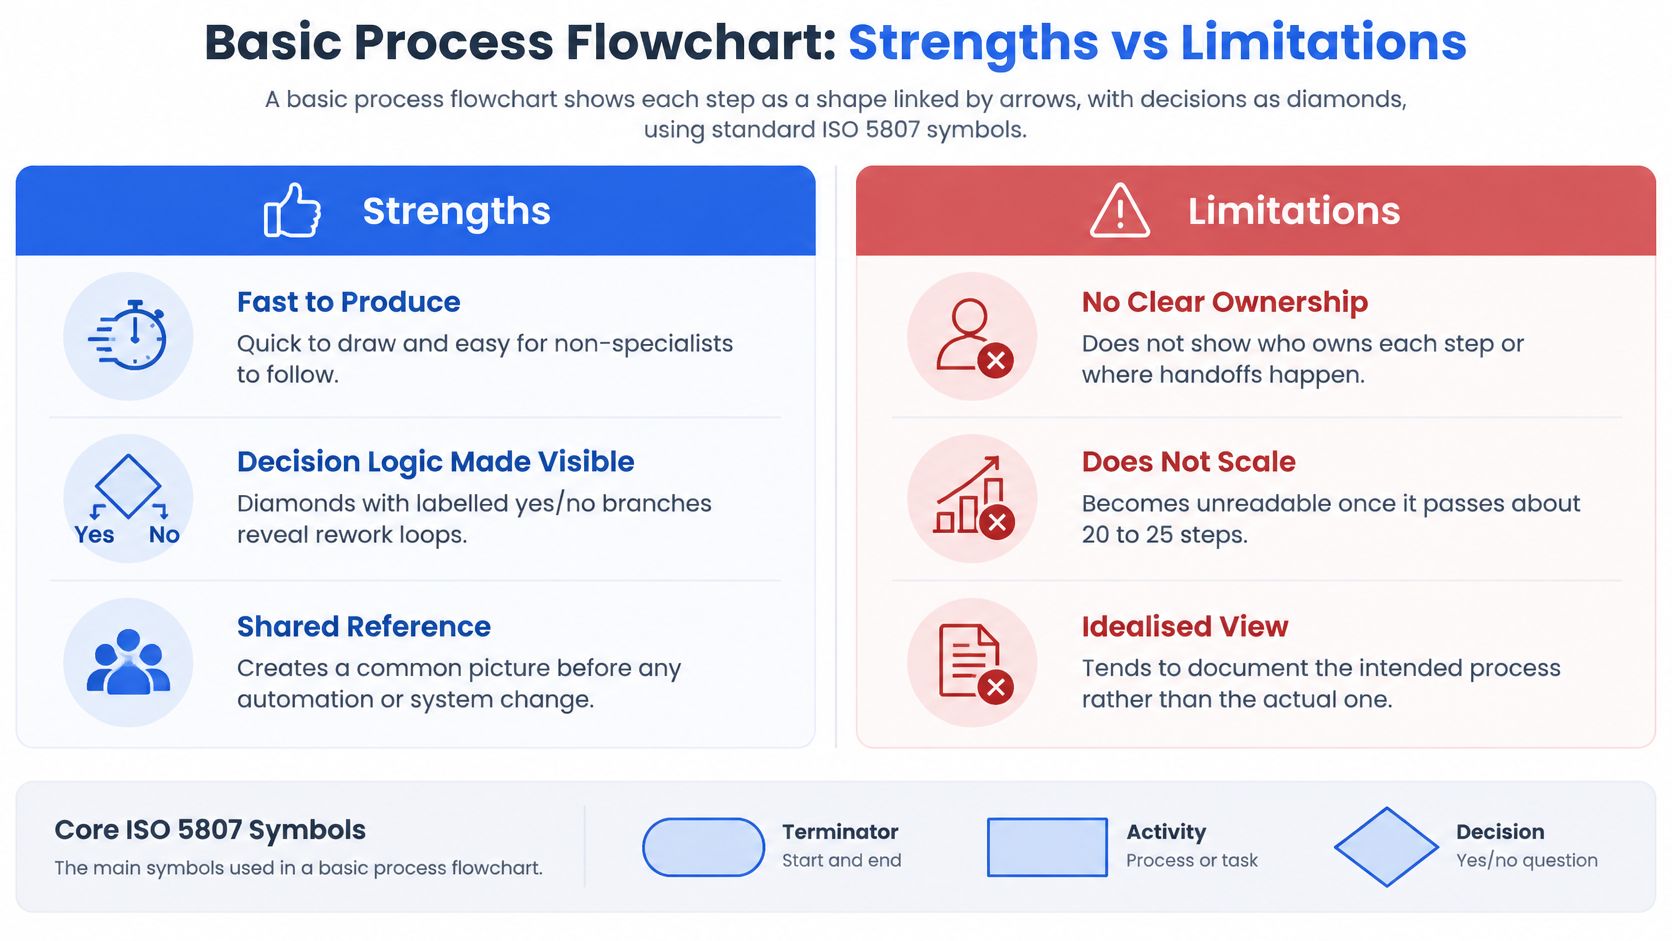
The comparison shows why flowcharts remain useful: they are fast to produce, expose decision logic and create a shared reference before change. The trade-off is equally important. They do not identify ownership, struggle beyond about 20 to 25 steps and often record the intended process rather than actual behaviour. Use the map to find questions, then apply a more detailed method when ownership, system interactions or cross-team handoffs need analysis.
2. SIPOC Diagram
A SIPOC diagram maps a process through five elements: Suppliers, Inputs, Process, Outputs and Customers. It provides a high-level view of who supplies the process, what it needs, what it does and who receives the result.
Teams use this method at the start of an improvement project to set clear boundaries before drawing detailed workflows. It became a standard part of Lean Six Sigma through Motorola engineering teams and Bill Smith's work on Six Sigma.
When to use it
Choose a SIPOC diagram when:
- The process crosses several teams or external parties.
- The project scope is still unclear.
- Different stakeholders describe the process differently.
- You need to identify missing inputs, outputs or customer expectations.
It is less useful for showing sequence, exceptions or approval decisions. Build a flowchart, swimlane diagram or value-stream map afterwards.
Practical implementation
Start with the customer column. Define who receives the output and what outcome they expect. Then work backwards through outputs, the process, inputs and suppliers.
For a hypothetical customer onboarding process, list inputs such as signed contracts and completed identity checks. Check each input against a real customer record rather than team memory. That exercise may reveal that the identity-check dependency belongs to an uninvolved compliance team.
A SIPOC diagram is strongest as a scope-setting tool, not as a detailed operating map.
Teams can use SIPOC to decide which process deserves detailed mapping instead of trying to map everything at once. For wider operational support, learn more about application management services.
3. Swimlane Diagram (Cross-Functional Flowchart)
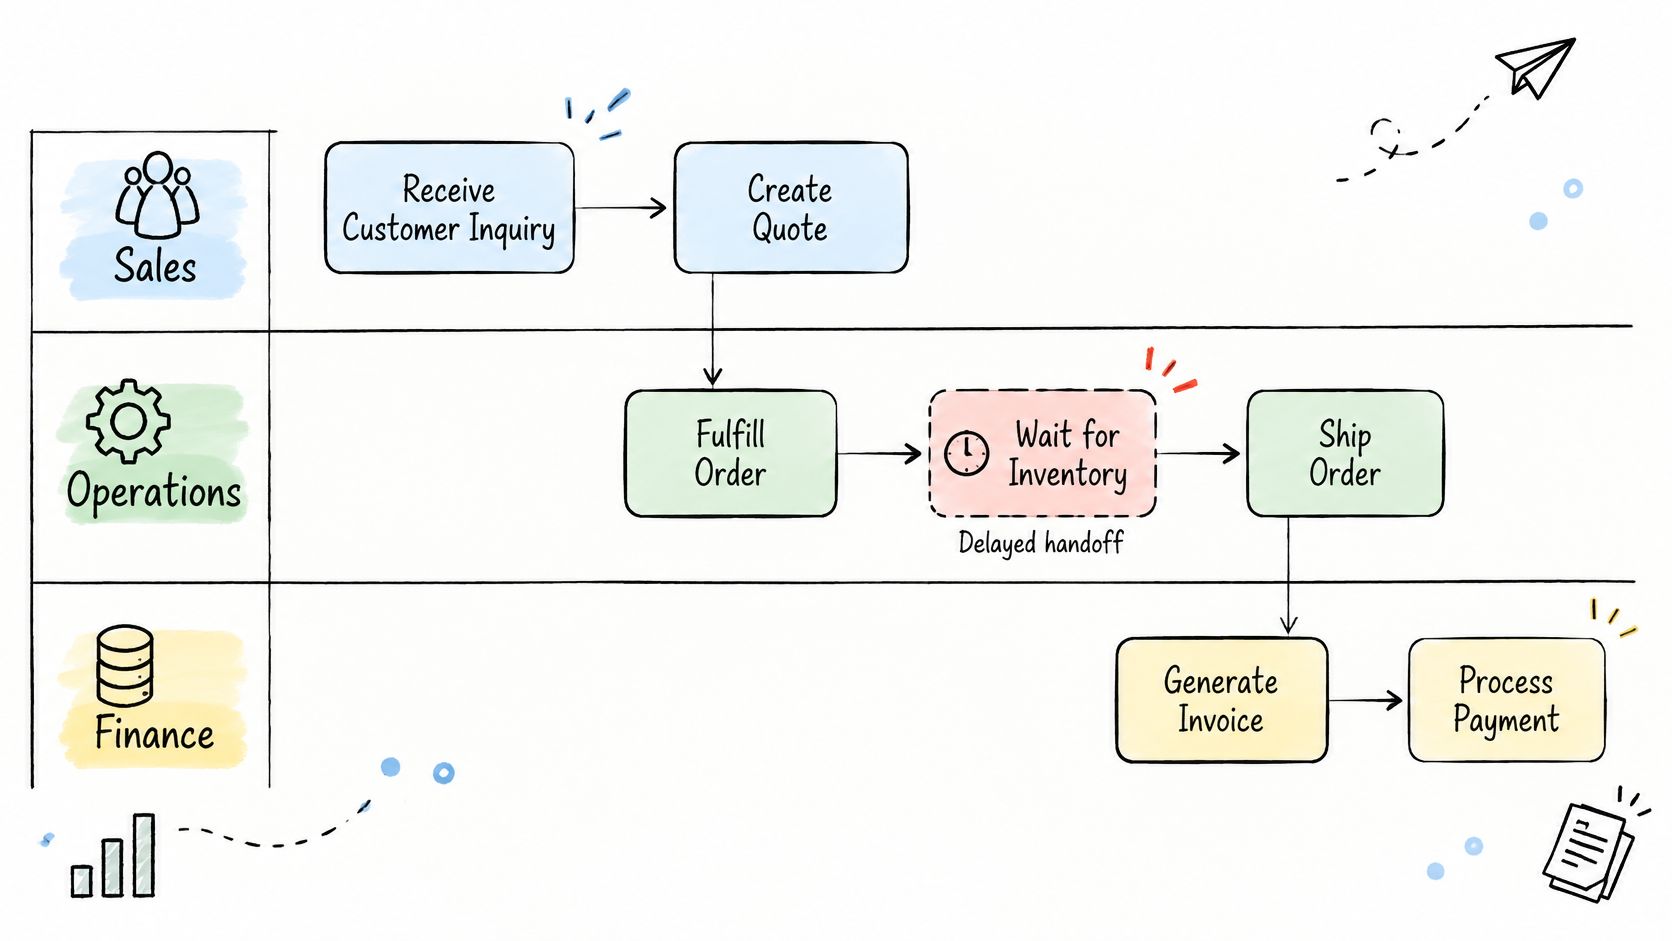
A swimlane diagram is a flowchart divided into horizontal or vertical lanes, with each lane representing a role, team or system. The method was popularised by Geary Rummler and Alan Brache in their 1990 book about managing gaps between departments on an organisation chart. Its practical strength is that it exposes handoffs, where delays, rework and missing accountability often occur.
When to use it
Choose a swimlane diagram when:
- A workflow passes between several departments, teams or systems.
- Approvals, reviews or procurement stages create queues.
- Teams need to see who acts, who waits and where ownership changes.
- The process crosses several tools, including email, chat, ticketing platforms or forms.
It is less suitable for a simple, sequential task with few handoffs. A basic flowchart would communicate that process more quickly.
Practical implementation
Consider a hypothetical purchase request moving through requester, budget owner, procurement and finance lanes. The diagram may reveal that two of the three handoffs happen by email, with no entry in the system of record. That creates delay, weak traceability and avoidable approval risk.
Add systems as lanes where relevant, rather than showing only people. Mark every handoff with its medium, such as email, chat, ticket or form. This makes it possible to identify hidden manual work and decide which steps should move into a managed workflow.
For workflows using Microsoft Teams, define how threads, files and approvals map back to the system of record. In ServiceNow, distinguish staged actions from committed actions so teams know when a request is genuinely approved.
A swimlane diagram is strongest when it answers a practical question: who is waiting on whom, through which channel, and with what evidence?
The method is an effective entry point among business process mapping methods for approval-heavy processes, provided the team maps actual behaviour rather than the intended procedure.
4. Value Stream Mapping
Value stream mapping shows every step a piece of work takes from request to delivery, separating active work from waiting time. Rooted in lean manufacturing and the Toyota Production System, it usually starts with a current-state map before teams design a future-state version.
The method earns its place among business process mapping methods because it exposes queues that conventional task lists often conceal. For example, a release team might discover that a change takes 14 days to ship, but only two days involve active work. The remaining 12 days may be spent waiting for test environments, approvals or specialist review.
When to use it
Choose value stream mapping when:
- Lead time is much longer than the time spent completing tasks.
- Work passes through several teams, tools or approval stages.
- Leaders need to see where delays accumulate across an end-to-end workflow.
- The team can collect timings from real work items rather than relying on estimates.
It is less suitable for a short, stable workflow with only a few steps. A basic process flowchart may communicate that process more clearly.
Practical implementation
Trace several representative items from request to delivery. Record processing time, waiting time, handoffs, batch sizes and the information exchanged at each stage, including tickets, specifications and approvals.
Then build the future-state map by removing or shortening the largest waits. Give every proposed action a named owner, because an unowned improvement is unlikely to survive contact with delivery. For leaders assessing stalled software work, this also provides a practical bridge into the agentic software development life cycle.
Value stream mapping is strongest when it changes where the team focuses, not when it produces a more detailed diagram.
Mike Rother and John Shook's Learning to See helped popularise the method through lean transformation programmes. Its lasting value is straightforward: separate what people do from what they wait for, then assign ownership to the changes that matter.
5. BPMN 2.0 (Business Process Model and Notation)
BPMN 2.0 is the formal notation for documenting business processes, maintained by the Object Management Group (OMG). It uses defined symbols for events, activities, gateways, pools, lanes and sequence flows. This gives technical and operational teams a common language for tracing how work moves through a process.
This method deserves a place among the best business process mapping methods because it combines visual clarity with exchangeable model data. A BPMN diagram can be imported into supported tools and, where the notation and tool support align, used to configure a workflow engine.
When to use it
Choose BPMN when:
- A regulated process must support audit, review or control evidence.
- Several teams share responsibility across clearly defined pools and lanes.
- A process needs to be handed to engineers for automation.
- Exception paths, timers, messages and automated decisions must be explicit.
- Stakeholders need a precise model rather than a simplified flow diagram.
It is less suitable for a quick workshop where the main aim is to build shared understanding. BPMN can also become unreadable when every rule, screen and data field appears in one diagram.
Practical implementation
Start with the process boundary, then separate participants into pools. Assign ownership to lanes, and use sequence flows only where the flow makes operational sense. Keep one level of detail per diagram. A high-level view should link to separate subprocess models for detailed approvals, disputes or recovery paths.
Model exceptions in the first draft. Cancellations, failed fulfilment, rejected claims and administrative recovery often reveal more production defects than the happy path. This approach exposed missing paths in a 27-state platform model covering 39 transitions.
Before handing the diagram to engineers, confirm which events are triggered by people, systems or external messages. A visually convincing diagram can still produce unreliable software when trigger ownership remains ambiguous.
BPMN is most valuable when the model is precise enough to expose exceptions and simple enough for operational teams to use.
Banks, insurers and public agencies commonly use BPMN for auditable approval and case-handling processes. The notation suits teams that need a durable handoff between operations, compliance and technology, rather than simply a picture of the intended workflow.
6. Event-Driven Process Chain (EPC)
An Event-Driven Process Chain (EPC) describes a process as a sequence of events and functions. Each event records a completed state, while the function that follows performs the work triggered by that state. For example, "order confirmed" can trigger credit checking, which produces "credit approved" and sends the order towards fulfilment.
Developed by August-Wilhelm Scheer within the ARIS framework in the early 1990s, EPC became closely associated with enterprise resource planning (ERP) systems. The SAP R/3 reference process model used EPC notation, helping organisations connect business processes with ERP configuration.
This method deserves a place among business process mapping methods because it makes the handoff between business states and system actions explicit. It is particularly useful when a process follows standard ERP transactions and teams need to identify ownership, control points and configuration gaps.
When to use it
Choose EPC when:
- The process is tightly coupled to an ERP platform, such as SAP.
- Key events correspond to posted documents or auditable system states.
- Functional teams need to see how finance, sales, logistics and production interact.
- Process owners want to compare actual transactions with configured system behaviour.
EPC is less suitable when several non-ERP systems dominate the workflow. It can become misleading if the diagram implies that every transition occurs through one transaction system. In that situation, Business Process Model and Notation (BPMN) usually provides a clearer view of messages, gateways and external participants.
Practical implementation
Consider a hypothetical manufacturer mapping its order-to-cash cycle. The EPC could connect "order confirmed" to a credit-check function, followed by "credit approved" and a release function leading to "goods issued". Each event can be linked to the ERP module that owns the relevant transaction.
Name events as observable states, not activities. Use "invoice posted", "delivery confirmed" or "payment received", rather than "post invoice" or "receive payment". This keeps the distinction between what happens and the state that triggers the next function clear.
Before using the model to guide configuration, compare it with ERP transaction logs. Check whether skipped steps, manual adjustments or undocumented approvals appear in the operational record.
EPC is strongest when it connects a visible business state to the system function and ERP transaction that produced it.
7. Event Storming
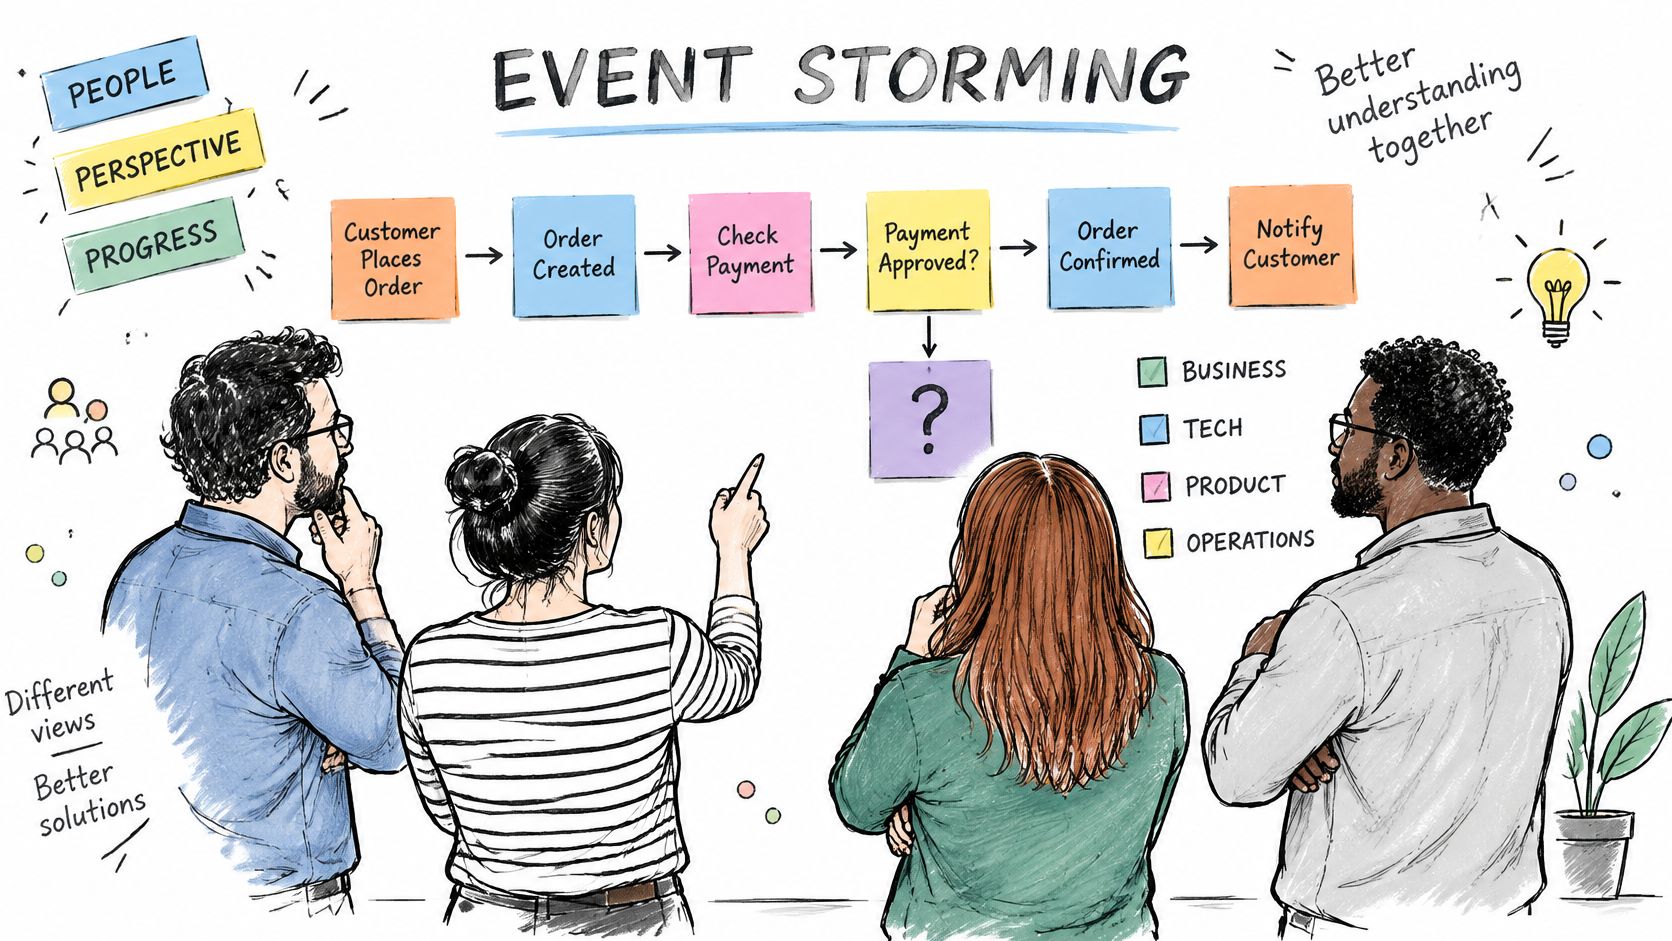
Event storming is a collaborative workshop method created by Alberto Brandolini. Participants place coloured sticky notes on a wall to capture domain events, the people who trigger them, and the policies that connect them. It is one of the most useful business process mapping methods when a workflow is poorly understood or teams disagree about how it works.
When to use it
Choose event storming when:
- A legacy codebase contains undocumented business logic.
- Operations, product and engineering teams use conflicting terminology.
- A rebuild needs a shared view before architecture or interface design begins.
- The team needs to identify missing decisions, approvals and system handoffs.
A half-day session works well for one end-to-end journey, such as enquiry to first payment. Avoid mapping the whole organisation at once. The method is designed to expose the story behind the process, not produce a polished architecture diagram on its own.
Practical implementation
For a hypothetical refund workflow, place events such as "Refund requested", "Refund approved" and "Refund completed" in chronological order. Then add the actor behind each event and the policy that permits it. If three teams define "completed" differently, record each interpretation rather than forcing agreement too early.
Follow these steps during the session:
- Start with one real customer or transaction journey.
- Ask participants to describe what happened, in the past tense.
- Add unclear exceptions as separate notes.
- Assign an owner to every unanswered question.
- Photograph the wall and transcribe it into a structured model within 48 hours.
The final step matters. Notes lose context quickly, and a photograph alone is not a usable process model.
Event storming works best as a shared discovery method, then feeds into flowcharts, domain models and technical design.
This approach deserves a place in the list because it combines speed with domain learning. It gives technical and operational teams a common language before software decisions harden around assumptions. Its limitation is that the output can remain subjective, incomplete or overloaded. Use it to expose uncertainty, then apply more formal methods where execution order, ownership or system interfaces require precision.
8. Process Mining
Process mining reconstructs how work actually runs by analysing event logs from ticketing, ERP and customer relationship management (CRM) systems. Unlike a designed flowchart, it reveals repeated paths, skipped steps, loops and unexpected variations. This makes it one of the most evidence-led business process mapping methods, especially where the documented process has drifted from daily practice.
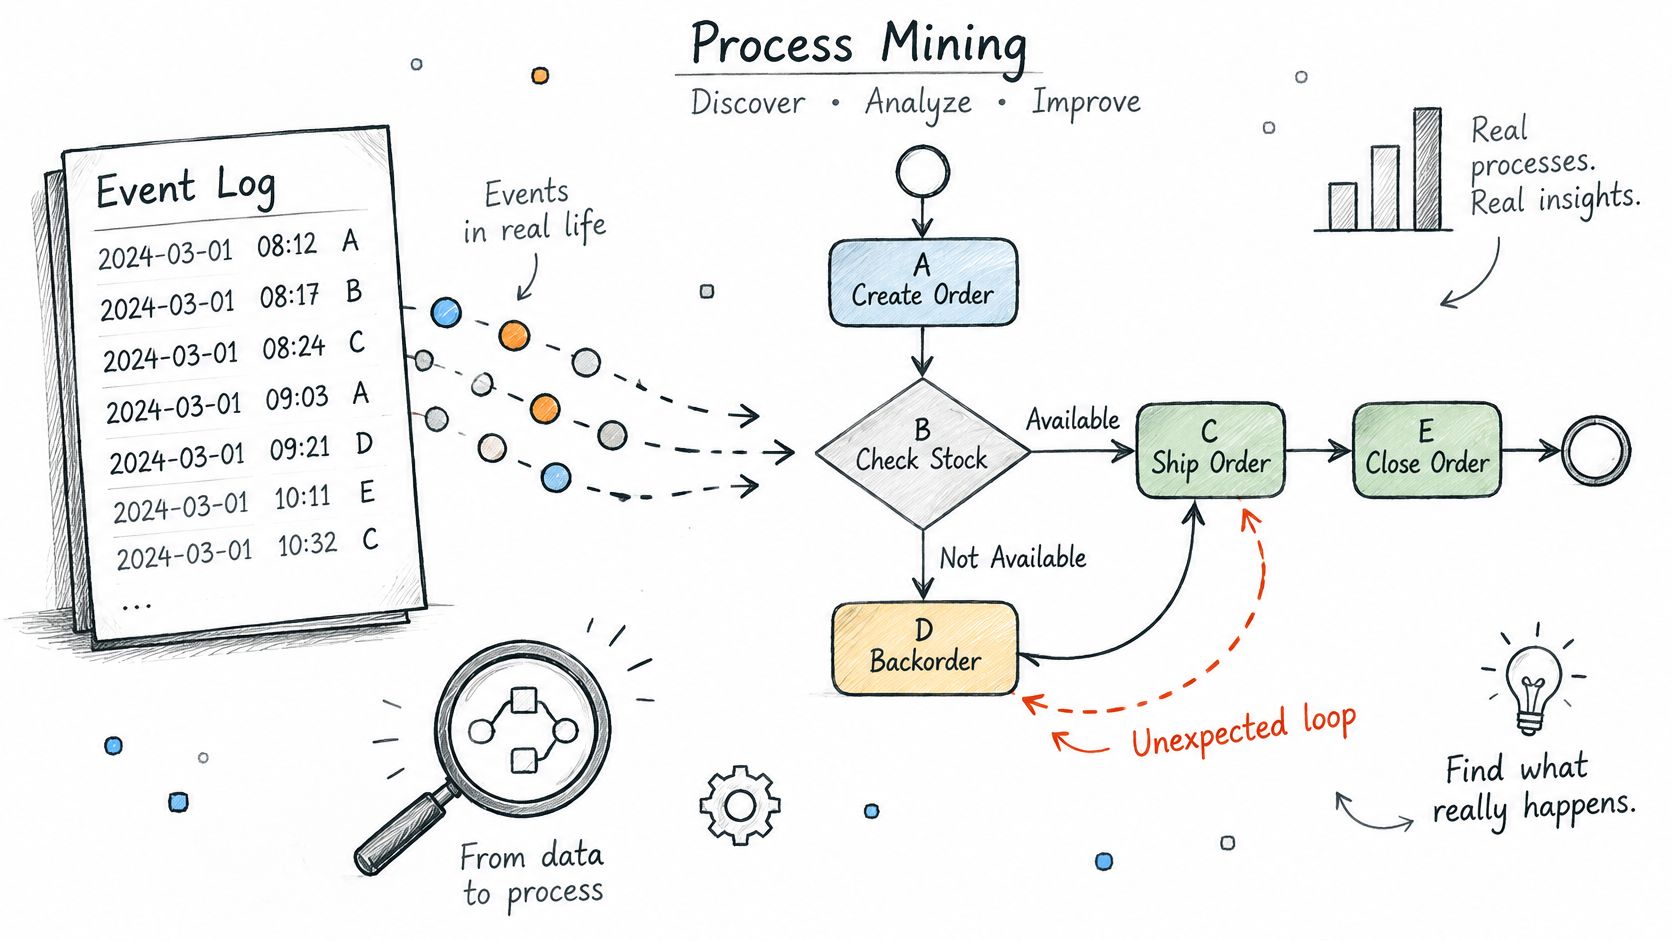
Developed through academic work led by Wil van der Aalst and colleagues at Eindhoven University of Technology, the method has been applied in peer-reviewed studies across healthcare, public administration and finance. Its practical value comes from comparing the discovered process with the intended one.
When to use it
Choose process mining when:
- The process generates reliable timestamps across several systems.
- You suspect staff work around the official procedure.
- Rework, delays or skipped approvals need evidence.
- A future automation depends on understanding exceptions.
For example, a hypothetical insurance team expects every claim to follow five steps. Event-log analysis shows that 30% of claims pass through a manual re-check missing from every documented model. That finding turns an assumption into a question the process owner must answer.
Practical implementation
Start with one workflow, one owner and one measurable outcome. Avoid mining every system at once, because poor data definitions and unrelated events can obscure the useful pattern.
Compare the discovered process with the documented one, then record each difference as a question rather than an automatic defect. Ask whether the variation is necessary, caused by a system limitation or an informal workaround.
Before expanding an automated workflow, confirm that the owner can explain it plainly, that the exception queue is small and well categorised, and that stakeholders accept the approval boundary. Process mining supports platform discovery and reconstruction well, but it cannot decide which exceptions should remain manual.
Process mining shows what happened; process owners still have to decide what should happen next.
This matters when an inherited platform is being modernised. Learn more about legacy system migration services to connect observed workflows with the wider re-platforming decision. You can also book a call at grail.computer or start an outcome engagement with a 15-day trial.
Business Process Mapping Methods: 8-Method Comparison
| Method | Implementation Complexity | Resource Requirements | Expected Outcome | Ideal Use Cases | Key Advantage |
|---|---|---|---|---|---|
| Basic Process Flowchart | Low | Process knowledge; basic diagramming tool | Clear view of steps, decisions, and loops | Simple, linear processes with a clear start and end | Quick to create and easy to understand |
| SIPOC Diagram | Low | Stakeholders familiar with suppliers, inputs, outputs, and customers | Agreed process scope and key dependencies | Early-stage improvement projects and process selection | Aligns teams on boundaries before detailed mapping |
| Swimlane Diagram | Low to moderate | Knowledge of roles, teams, systems, and handoffs | Process steps organised by owner, with handoffs visible | Approval-heavy workflows spanning multiple teams | Makes ownership and handoff delays clear |
| Value Stream Mapping | Moderate to high | Cross-functional team; real process and waiting-time data | Current- and future-state maps showing delays and waste | Improving end-to-end flow in operations or software delivery | Quantifies waiting time and improvement opportunities |
| BPMN 2.0 | High | Trained modellers; compatible modelling tools | Precise, standardised process models, sometimes executable | Audited processes, complex workflows, and system implementation | Supports detailed exception modelling and tool exchange |
| Event-Driven Process Chain (EPC) | Moderate | ERP and process knowledge; EPC-capable modelling tools | Event- and function-based models linked to organisational or system elements | ERP-heavy processes and system configuration | Connects process states and activities to ERP systems |
| Event Storming | Low to moderate | Facilitator; cross-functional participants; wall or digital board | Shared understanding of events, decisions, and open questions | Unclear processes, software rebuilds, and domain discovery | Surfaces disagreements and unknowns quickly |
| Process Mining | High | Structured event logs; analytical tools; data-governance support | Evidence-based model of actual process paths and performance | Comparing real execution with documented processes | Reveals actual behaviour and quantifies process variants |
Picking the Right Map for the Question You Are Asking
No single business process mapping method answers every question. The best choice depends on what you need to see, agree or improve. Most teams combine two or three methods rather than forcing one diagram to carry the whole process.
Choose the map that matches the decision you need to make, not the map that looks most sophisticated.
Match the method to the decision
- Basic flowchart or SIPOC for scope: Use these to define what is in and out of the workflow. A SIPOC diagram is especially useful when suppliers, inputs, outputs and customers are unclear.
- Swimlane diagram or BPMN 2.0 for ownership and handoffs: A swimlane makes responsibilities visible. BPMN 2.0 adds the detail needed to model decisions, exceptions and interactions between systems.
- Value stream mapping for delay: Use it to expose waiting time, work queues and uneven capacity. It helps teams distinguish activity from value creation.
- Event storming for shared understanding: This works well during a rebuild because it separates events, decisions and reactions. People can challenge the process before anyone commits it to detailed documentation.
- Process mining for the difference between design and reality: Use event data to test whether the documented workflow matches what actually happens. It can reveal compliance gaps, repeated steps and hidden variations.
Test the map against real work
A map should never remain a conceptual exercise. Choose one live case, walk through it with the people who perform the work, and record every point where the diagram differs from reality. Those differences are valuable: they expose missing owners, undocumented exceptions, system constraints and decisions waiting for authority.
If the map reveals a bottleneck that needs broader intervention, a structured business process optimisation effort can turn enterprise strategy into daily execution. Start with the workflow that is hardest to explain, not the most visible one. Fixing one contested process can establish a practical pattern for the rest.
The value of mastering business process mapping methods is not better documentation alone. It is faster agreement, clearer accountability and evidence about where delivery is slowing down. In a stalled software product or inherited codebase, that evidence can give a technical team and its stakeholders a shared starting point for recovery.
If one workflow has become difficult to explain, Grail Computer Labs can help turn it into an evidence-based case for improvement through an outcome engagement, which delivers one pre-defined, measurable outcome in 4-8 weeks. Qualified clients can use the 15-day trial to stop within the first 15 days without paying. Book a call with Grail Computer Labs to discuss the process and the outcome you need.