
Business Process Optimization: Find and Fix Bottlenecks
Learn how business process optimization works: map workflows, find bottlenecks, measure results and choose the right fix before adding automation.
Every operations leader has had this conversation. Something in the business keeps slipping, a customer onboarding, a release, a contract going out for signature, and someone proposes buying software to fix it. The tool gets bought. Six months later the same work takes the same time, except it now passes through one more screen and needs one more login.
The constraint is rarely the tool. It's usually the design of the workflow and the absence of any honest way to prove that a change made things better. Teams can spend a quarter choosing a platform and ten minutes deciding what success would look like.
The order of operations matters more than the technology. Map the work as it runs in practice, find the stage where cases queue, measure before and after, and only then choose between standardising, cutting hand-offs, moving a decision, automating a step or rebuilding the system. The same discipline applies when a previous attempt stalled and the knowledge walked out with the vendor.
What Business Process Optimisation Means in Practice
A purchase request arrives by email, sits in an approver's inbox for three days, gets re-keyed into a spreadsheet by someone in finance, and comes back to the requester with a question nobody can answer without opening two other systems. Nobody in that chain is lazy. The work is distributed across people, tools, and decisions that were never designed to meet.
Business process optimisation is the work of redesigning how a request moves across those people, systems and decisions so that delay, rework and cost fall while quality holds. It is a deliberate change to the shape of the work, and it usually makes somebody's week easier and somebody else's week more exposed.
Digitising Is Not Optimising
The distinction that matters most is between digitising and optimising. Digitising takes the existing steps and makes them faster to click through: the same seven approvals, the same three re-entries, now in a nicer interface with a mobile view. Optimising removes steps, moves a decision to the person with the context, and changes who hands what to whom.
Applied to the request above, digitising gives the approver a tidier screen behind the same three-day wait. Optimising asks why finance re-keys anything, and whether that first approval is a check or a habit.
A road with a single junction every car must clear does not move faster because you widen the lanes either side of it. You have helped traffic reach the queue sooner.
Interest in this work is broad. In 2024, 80% of 676 surveyed experts across six countries and eight industries said process management was important, according to the BearingPoint and BPM&O process management study. The same year, 77% of organisations said they needed stronger process capabilities to deliver their ambitions, as published by Implement Consulting Group.
Useful test: if the delay comes from approvals, rework or unclear ownership rather than from missing software, optimisation is very likely the right first move.
The honest limitation is that not every process deserves a redesign. A stable, low-volume process with a handful of cases a week usually needs a written standard, a named owner and a short annual review. Redesign earns its cost where volume, delay or error rates are causing measurable damage, and nowhere else.
A change nobody can measure is a change nobody can defend.
How to Map a Process Before You Change It
A process map is worth building only if it shows what really happens. Teams often already have a procedure document, and it's usually wrong in the places that matter, because it describes the intended path rather than the one cases take on a Friday afternoon.
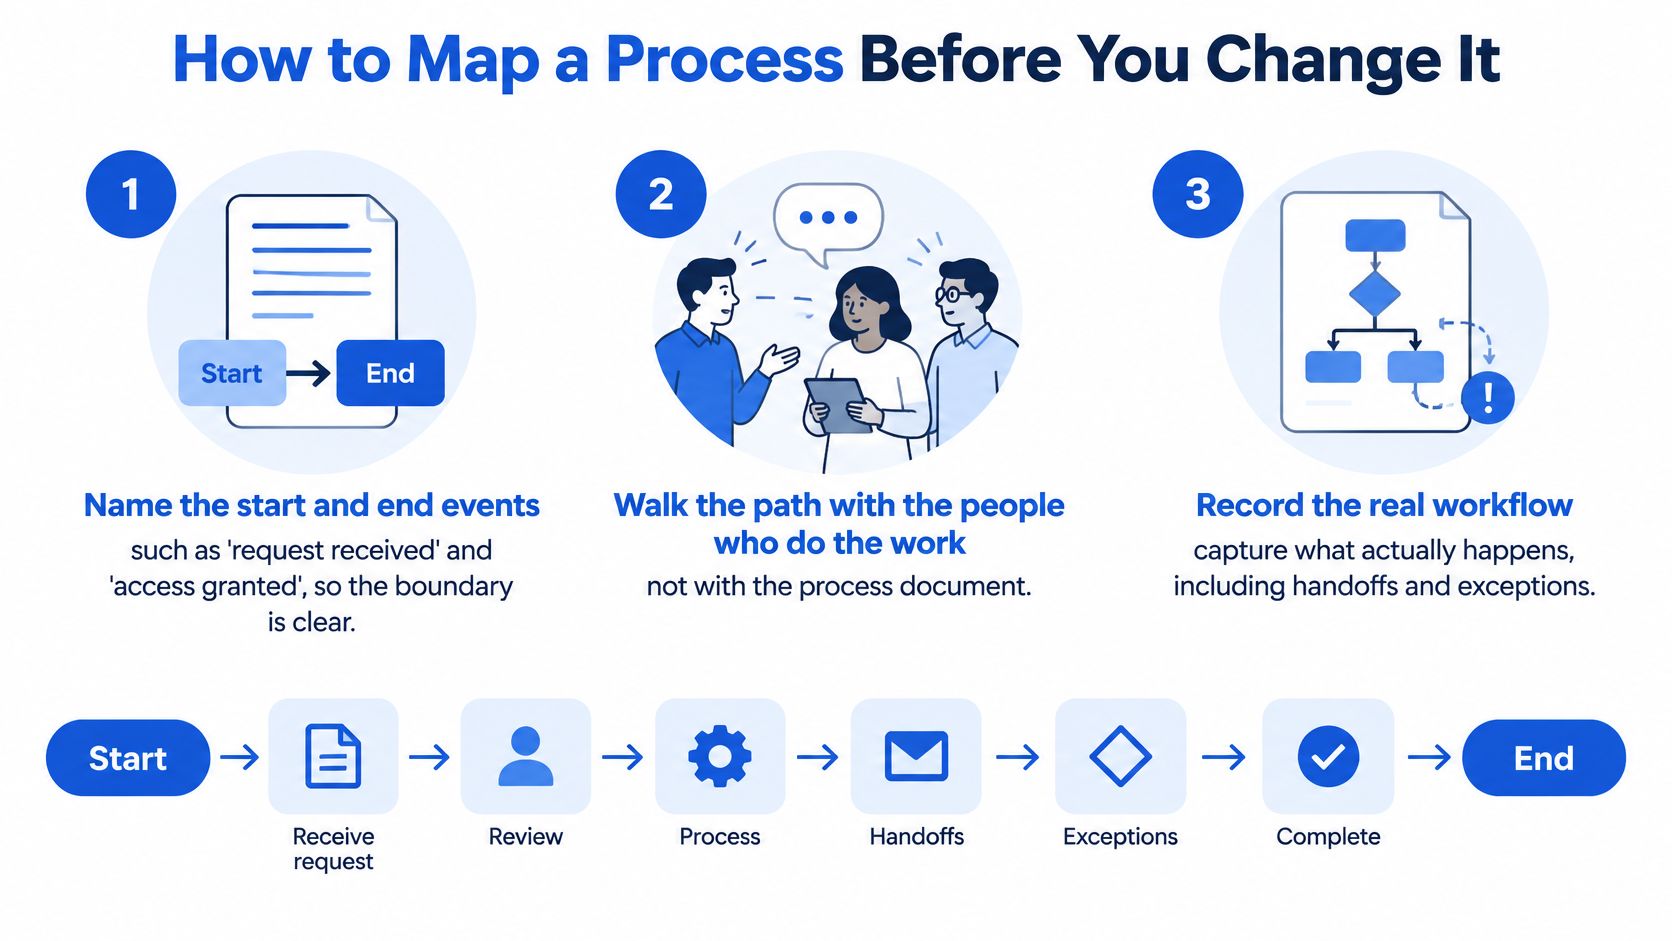
Name the start and end events. Anchor the map on observable events, such as "request received" and "access granted", rather than on departments. A clear boundary stops the map sprawling into everything the business does, and the common slip is choosing a boundary so wide that nobody agrees where it ends.
Walk the path with the people who do the work. Sit with the person who receives the request, not the manager who wrote the procedure, and ask them to show you the last five cases they handled. Sessions run with the process owner alone tend to reproduce the official version with more confident wording.
Record every step, hand-off, queue and rework loop on one page. Include the waiting, especially the waiting. A step that takes four minutes but waits a day is a different problem from one that takes four hours. Teams routinely leave the waits out because nobody performs them, so nobody remembers them.
Mark which steps change the work and which only wait. Annotate the two groups in different colours. This single distinction directs effort, and it usually reveals that most of the elapsed time is queue time rather than work.
Note each decision point, who decides and on what evidence. Where the rule turns out to be "whoever the requester knows", you've found a decision-rights problem rather than a capacity problem. The slip is writing down the rule you think should apply instead of the one people use.
Count weekly volume and the share of cases that leave the normal path. Tally one real week rather than estimating. Exceptions are often a third of the work and invisible in the procedure, which is exactly why improvements aimed at the happy path underdeliver.
Keep the first map narrow, roughly 5 to 15 steps. Say a vendor onboarding flow of twelve steps shows the finance check as a two-day queue that only starts once procurement has finished, while legal sits idle after its own review. The procedure says the checks run in parallel. The map says otherwise, and the map is the artefact worth acting on.
Then test it. Hand the page to someone outside the team and ask them to trace one real case from start to end using only that map. If they can't, it isn't finished. For notation and templates, map enterprise workflows step by step sets out the mechanics.
Finding Where the Bottleneck Sits in Your Workflow
A bottleneck is the stage where work piles up in front of it while the stages behind it sit idle. That definition is more useful than it sounds, because it rules out the busiest team in the building. A group can look frantic and still not be the constraint.
The cheapest test is waiting against working. Take ten real cases and record how long each one waited at every stage versus how long someone actively worked on it. If a case waits two days and receives ninety minutes of attention, the problem is scheduling, hand-offs or approvals, and adding headcount to the busy team moves the queue rather than shortening it.
| Symptom | Likely constraint | First check |
|---|---|---|
| Work piles up before one approver | Approval capacity or unclear authority | Count approvals per week and time from request to decision |
| Cases return to earlier steps | Missing information at intake | Tag the reason for twenty returned cases and count how many trace back to a missing field or document |
| Staff re-key data between systems | No integration between systems of record | Trace one case across every screen and log each copy |
| Backlog ages while volume stays flat | Exceptions routed into the main queue | Split exceptions into their own queue and measure each separately |
| Delivery slows after each release | Manual verification or unstable tests | Track rework rate and change fail rate for two cycles |
| Output varies by person | Undocumented decision rules | Ask three people to decide the same five cases and compare the results |
Every check in that table costs less than a day. None needs a licence, a steering committee or a new hire. Run them one stage at a time, because a change that fixes two stages at once tells you nothing about which one worked.
Watch the upstream. The constraint is often at intake, or inside a decision rule nobody has written down, rather than in the team that looks most stretched.
That last row deserves attention. When three experienced people reach three different decisions on the same five cases, the process has no rule, only habits. Automating habits makes the inconsistency faster and harder to spot. Write the rule, test it against real cases, and only then decide what to automate.
Measures That Show Whether the Process Improved
Most process dashboards measure the wrong layer. They report monthly totals, which tell you what happened after the money was spent, but not which stage to fix or whether the change you shipped last month helped anybody.
| Measure | Definition | How to calculate | What it reveals |
|---|---|---|---|
| Cycle time | Elapsed time from case start to case close | Close time minus start time, median per week | A falling median means end-to-end flow is faster |
| Active processing time | Time someone spends working on the case | Sum of logged work time per case | A large gap to cycle time points to waiting |
| Queue time | Time a case waits between two steps | Entry time minus previous exit time, summed by stage | The highest stage is usually the first to fix |
| First-pass yield | Share of cases completed correctly without rework | Cases right first time divided by cases started | A low figure points to intake or instruction quality |
| Exception rate | Share of cases leaving the standard path | Exception cases divided by total cases | A rising rate can mean new edge cases or weak rules |
| Approval latency | Time from approval request to decision | Decision time minus request time, median | A long figure signals a decision-rights problem |
| Rework rate | Share of completed cases returned to an earlier step | Returned cases divided by completed cases | Track each return reason, because the total hides the cause |
| Cost per case | Labour and tool cost per completed case | Monthly cost divided by cases closed | Trust it only once flow measures are stable |
Read the table for the gap, not the absolute number. A median cycle time of six days against a median active processing time of two hours says the case waits almost entirely, and queue time by stage tells you which wait to attack first. First-pass yield and rework rate explain why throughput refuses to respond to extra effort: when a fifth of cases come back, every improvement upstream is being undone downstream and paid for twice.
A programme that holds up instruments in-process control points rather than final outcomes alone. NIST's Baldrige criteria commentary recommends identifying critical points as early as possible, because catching a deviation upstream costs far less than catching it at release. Each control point needs an explicit operating standard and a defined corrective action when performance falls outside it. In practice that means event-level telemetry at intake, triage, approval, verification and release, not one monthly throughput figure.
The operating design is unglamorous and it works:
- Baseline before you change anything, using several weeks of real cases rather than a quiet Tuesday.
- Set a threshold per stage, not one target for the whole process.
- Name an owner for each breach, so a number turning red has a person attached to it.
- Review trends, because a single average can hide a fortnight of deterioration.
Where a defect is caught decides what it costs. A missing document found at intake affects one case. The same document found at approval drags every case behind it in the queue.
The limitation is worth stating plainly. These measures show whether flow improved, not whether the improvement was worth the effort. Cost per case is the weakest of the eight, because it moves with volume and staffing as well as with the process, and it should only be trusted once the flow measures are stable. Business value needs a separate conversation about revenue, risk and customer outcomes.
Choosing Between Redesign, Automation and Rebuild
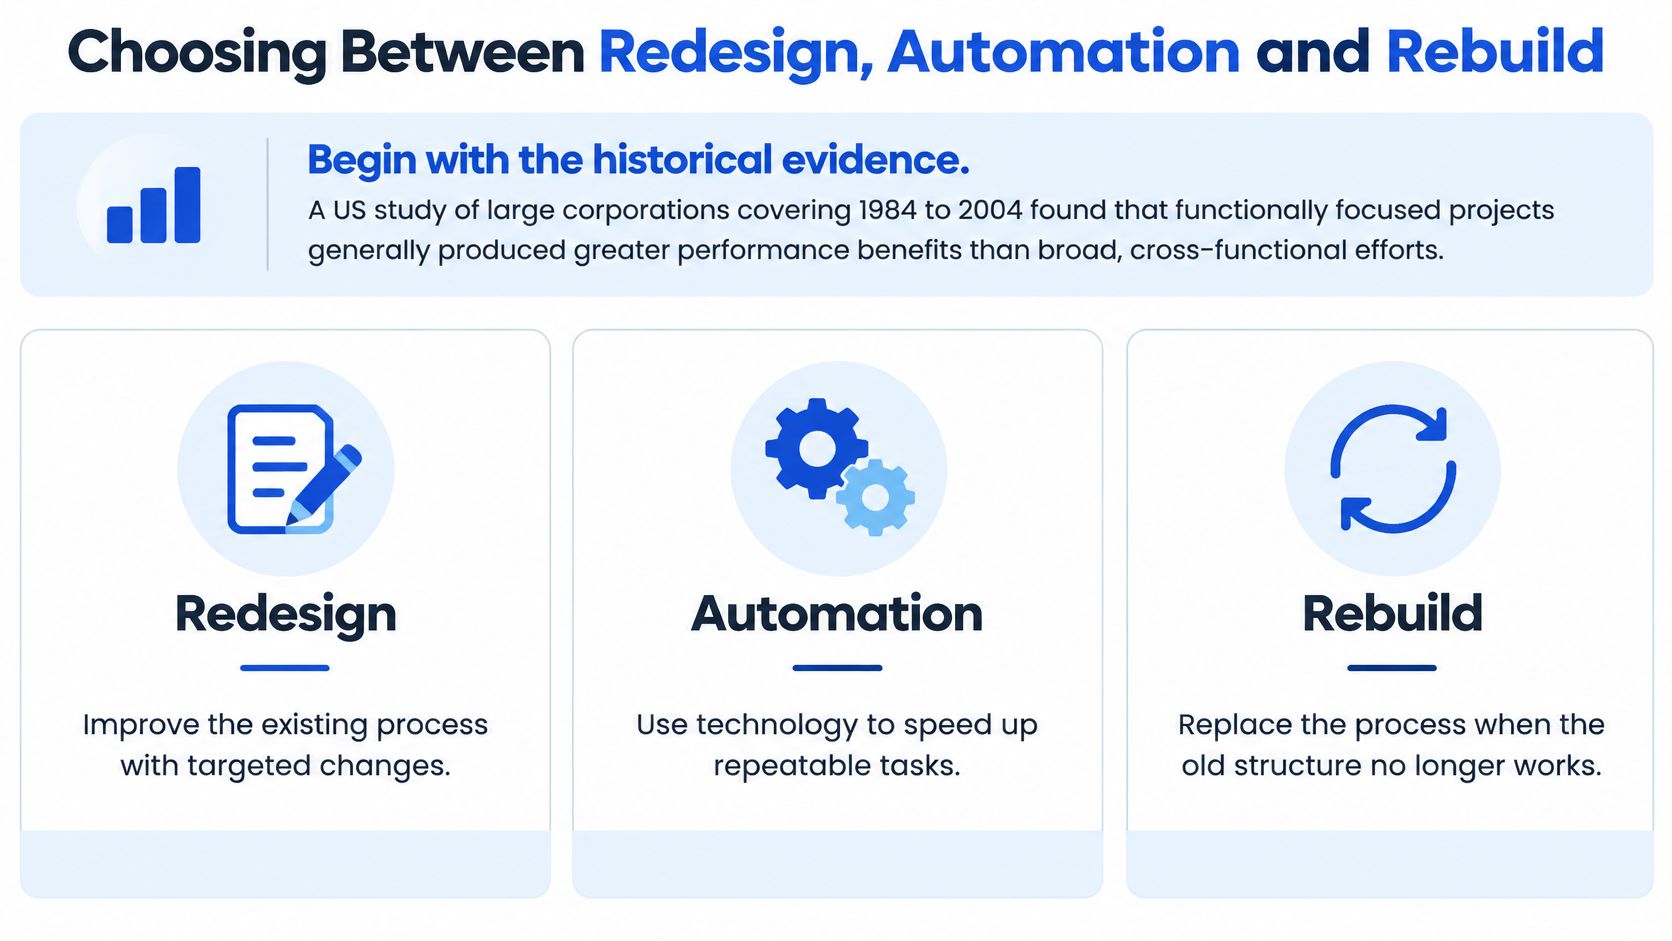
The evidence on large transformation programmes is more encouraging than its reputation suggests, provided you read the timing. An Arthur D. Little survey cited in academic research on business process reengineering found that only 16% of senior executives were fully satisfied with their reengineering programmes, while 68% experienced unexpected problems. Yet the same body of work, covering large US corporations from 1984 to 2004, found that company performance improved after projects were completed, with performance broadly stable during execution. Functionally focused projects generally delivered more than broad, cross-functional ones.
That pattern, disruption first and improvement after completion, is why scope discipline beats ambition every time:
| Option | Best when | Main risk | Reversible | Time to first evidence |
|---|---|---|---|---|
| Standardise current steps | Output varies because people run the same work differently | Locks in a poor process if the map was wrong | Yes | Days to a few weeks |
| Remove or merge hand-offs | Work waits between teams and adds no value | Moves risk onto the steps that remain | Yes | A few weeks |
| Reassign decision rights | Approvals wait for people who lack authority or context | Weaker control if rights move without a written rule | Yes | A few weeks |
| Automate a stable step | Same inputs and rules repeat at high volume | Automates a flaw; exceptions flood the queue | Partly | Several weeks for a bounded outcome |
| Rebuild or replace the system | A legacy platform blocks every change | Highest cost and disruption; knowledge can be lost | Difficult | Months |
Those timings are indicative, not commitments, and they assume someone owns the outcome by name.
A second lesson sits inside the same evidence. A programme that touches twelve departments has twelve chances to stall and no single measure of success, while a workflow with one owner and a countable output has one. Test any tool against a real workflow. Grail Computer Labs' position is that an AI or automation choice should be evaluated against one real workflow, one real owner, one real approval path and one measurable business outcome. Anything less is a demo. If a supplier can't run that test inside a fortnight, the pilot tells you nothing about production. For teams where agents do more of the building, agentic software development life cycle explains how the delivery loop changes.
If you're comparing automation platforms rather than redesign options, business automation software for internal tools surveys the category sensibly.
Then the verdict by situation:
- Stable rules, high volume, low variance: automate. The step already behaves, so the gain is speed and consistency.
- Every case needs different judgement: fix decision rights first. Automating judgement you haven't written down builds a faster queue of exceptions.
- A legacy platform blocks every change: plan a staged rebuild with an exit path, because no amount of process design survives a system nobody can change safely.
- Nobody can describe how the work runs today: standardise what exists before touching anything else.
Recovering a Stalled Optimisation Project Without Losing Knowledge
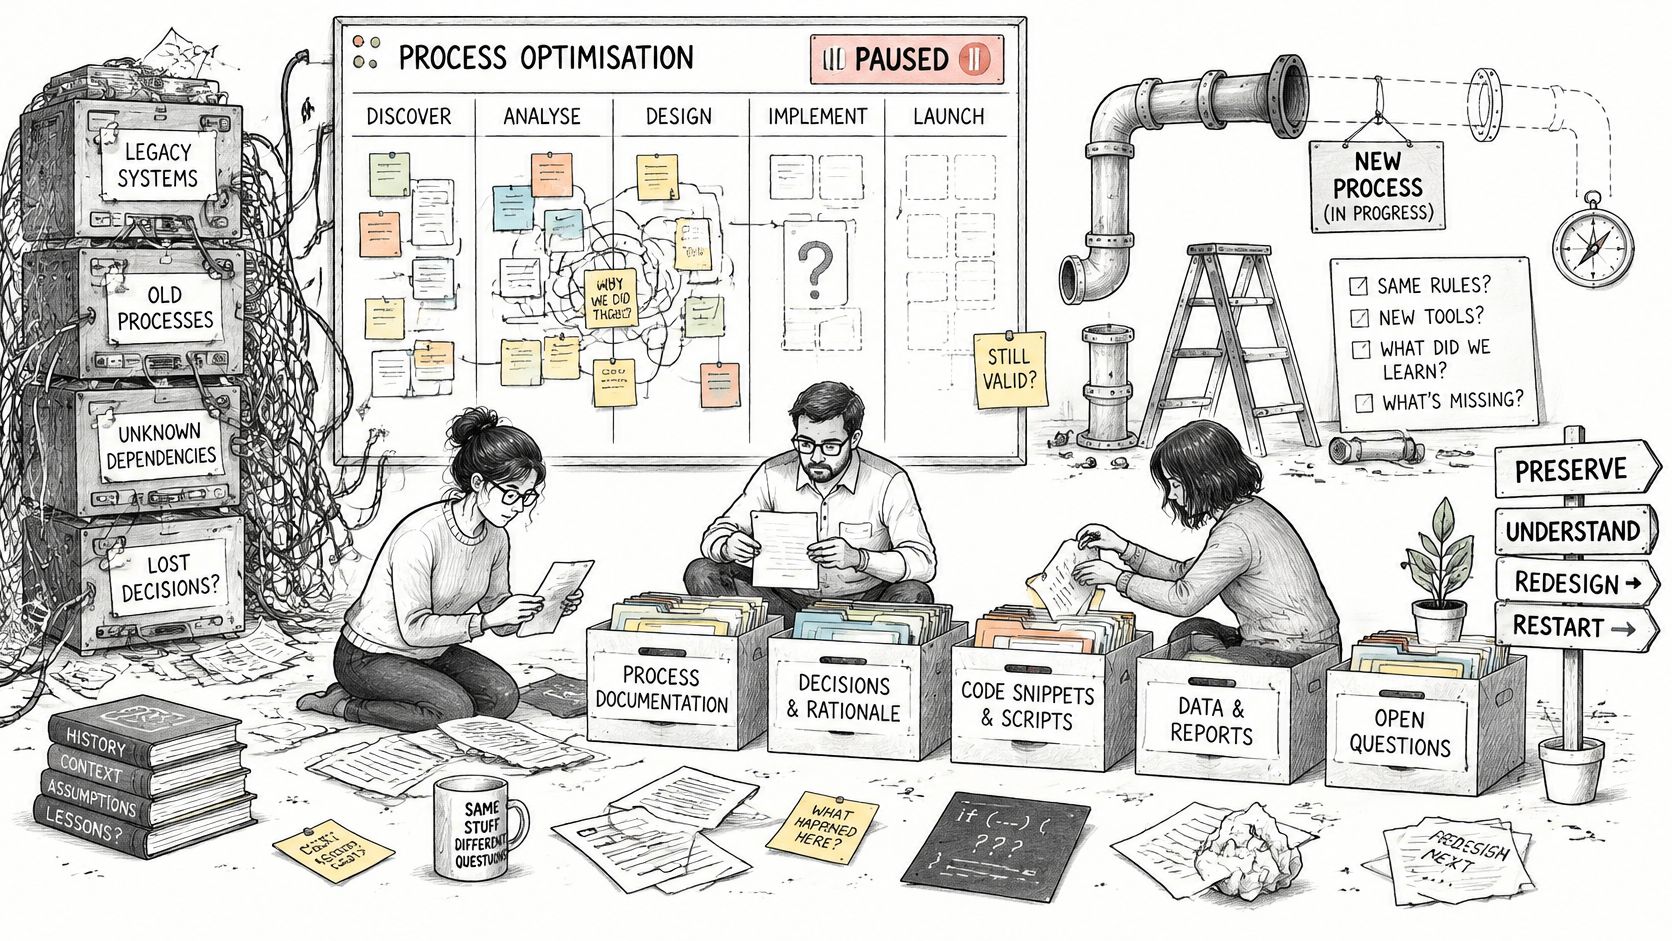
Projects rarely stall because nobody knows what to do next. They stall because the knowledge needed to continue lives with people who left, in decisions nobody wrote down, or in a codebase only one supplier understands. Recovery is a different discipline from greenfield design, and the first job is preservation rather than velocity.
Legacy integration is often where that knowledge debt surfaces. In Protiviti's 2025 AI Pulse survey, 30% of organisations cited integration with existing systems as their biggest AI obstacle. Older platforms typically bring incompatible data formats, outdated architecture and thin API coverage, which turns every change into archaeology before it becomes engineering.
A recovery sequence that holds up:
- Preserve decisions and domain knowledge first. Before touching code, capture why the system works as it does, who decided what and which constraints are real. A decision record written in week one saves a month of guessing later.
- Audit the actual process and the actual codebase. Talk to the people who run it daily, then read the parts of the code that carry money, access and customer commitments.
- Separate recoverable components from unsafe ones. Some of the inherited build is fine and should be kept. Pretending otherwise is how rescues become rewrites.
- Define one measurable outcome with a short horizon. A tight window forces scope that can be verified rather than described.
- Transfer ownership through documentation, tests, observability and controlled releases. If the client cannot change the system without the original team, the rescue is not finished.
A worked example makes that concrete. An enterprise healthcare platform had spent six months struggling with its previous vendor before Grail Computer Labs took over and rebuilt the platform in 30 days; by day 40, it had onboarded 100 business customers. One case shows what is possible under a particular set of constraints. It does not promise the same timeline elsewhere, and the audit is what decides which components can be kept. For teams weighing replacement over repair, legacy system migration services covers staged re-platforming without stopping the business.
Grail's recommended pattern for internal workflows carries over to recovery: connect directly to the system of record, make each handoff explicit, keep approvals inside the team's operating rhythm, and record enough context that the next reviewer can see why an agent or a person acted as it did. The same discipline governs risk. Any step that moves money, changes access, alters customer commitments or creates legal exposure needs an explicit approval rather than an inference.
The recovery test: could an internal team or another supplier take this over tomorrow without losing the reasoning behind it? If not, the knowledge is still trapped.
Pick One Workflow and Confirm Its Owner
Start with one recurring workflow that has real volume and a named owner. Not the most painful workflow, and not the most strategic one. The one where volume is countable, the owner is identifiable and a result can land inside a few weeks.
Quarterly business review (QBR) prep is a strong first candidate. It repeats on a fixed rhythm, it's mostly collection and summarisation rather than fresh judgement, and it removes visible busywork from customer success and account management. Vendor onboarding, access reviews and monthly reporting share the same shape: predictable, owned, countable.
The sequence doesn't change. Map the workflow using the steps above, record a baseline for the flow measures over several weeks, then decide. Skipping the baseline is the most common way teams end up arguing about whether anything changed.
Before expanding, run a go or no-go check:
- The owner can explain the workflow in plain language, without deferring to a diagram.
- The exception queue is small enough to review and well categorised.
- The approval boundary is explicit and accepted by the business stakeholders who will live with it.
Two out of three isn't a pass. The wider picture supports the caution. In 2024, the share of business processes reported as automated was 50%, down from 52% in 2023, according to Camunda's State of Process Orchestration report. More tooling doesn't automatically mean a better process, and part of that decline is probably teams discovering exactly that.
Not every process needs optimising. A stable workflow with low volume needs a written standard, a named owner and a review once or twice a year. For teams already running a platform day to day, application management services covers what ongoing ownership looks like once the first workflow settles.
Grail Computer Labs works with enterprises and private equity (PE) backed companies on precisely this problem: find the one workflow that matters, map it clearly, and deliver a measurable outcome in 4 to 8 weeks instead of a platform decision made in the abstract. Qualified clients can stop within the first 15 days without paying, and the code, cloud environment, models and documentation stay with you throughout. Book a call at Grail Computer Labs and bring one workflow to the conversation.